Desktop Tools Directory for Network Monitoring & Learning
A curated directory and technical guide to desktop tools, telemetry dashboards, local test nodes, and diagnostic utilities used for studying Dime and decentralized systems.
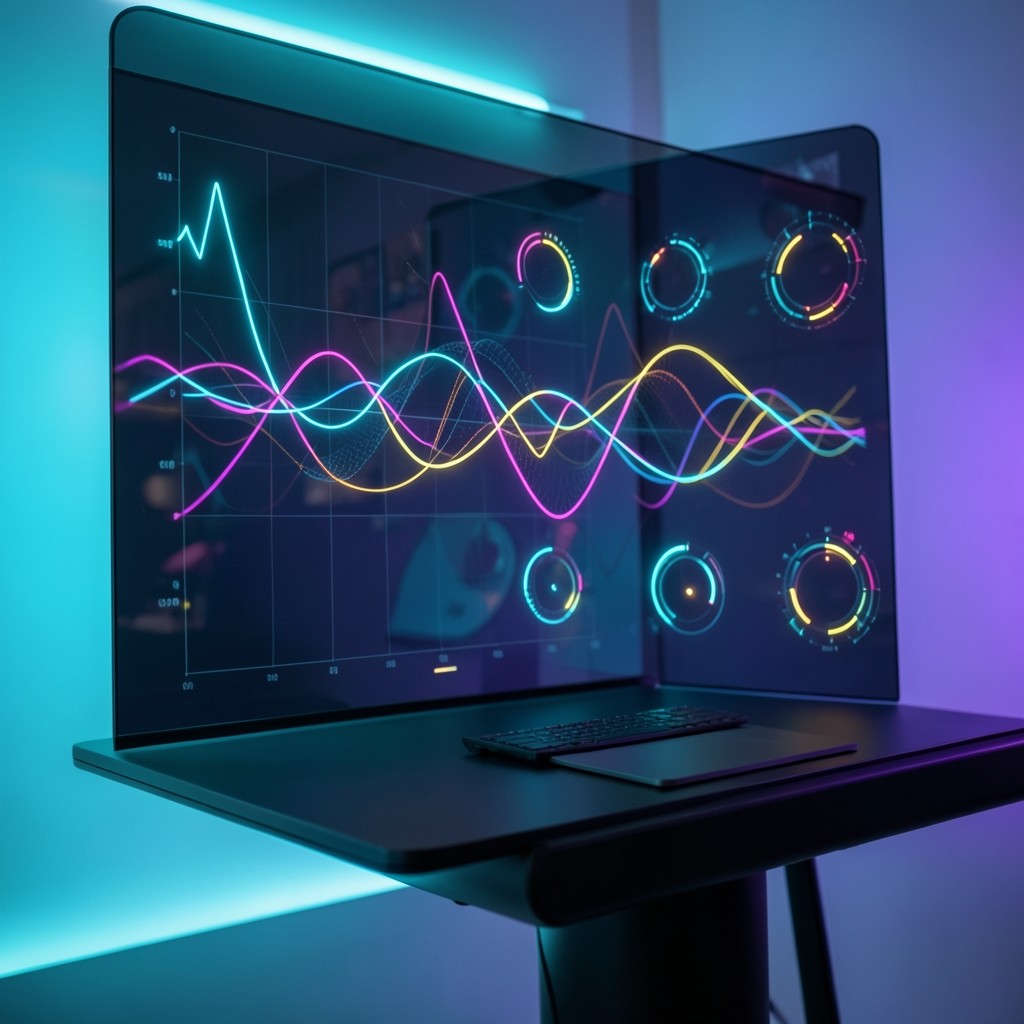
Why Use Desktop Tools for Technical Learning?
While web-based block explorers provide high-level historical overviews, hands-on learning in distributed systems requires direct observation of local node behavior, RPC message traffic, and real-time state transitions.
This educational directory highlights the primary categories of desktop and command-line utilities utilized by students, engineers, and researchers to study Dime and Web3 architecture.
+--------------------------------------------------------------------------+
|                 DESKTOP RESEARCH & MONITORING WORKFLOW                   |
|                                                                          |
|  [ Local Sandbox Node ] <---> [ CLI Diagnostic Utility ]                 |
|            |                             |                               |
|            v                             v                               |
|  [ JSON-RPC HTTP / WS ] <---> [ Telemetry Dashboard / UI Inspector ]     |
+--------------------------------------------------------------------------+
1. Local Sandbox & Testnet Simulators
Running a single-node or multi-node local cluster allows learners to experiment safely without network fees or latency constraints:
- Instant State Resets: Wipe and re-instantiate clean ledger states to test edge cases.
- Slot Time Adjustment: Slow down block production to step through state changes step by step.
- Deterministic Account Seeding: Pre-populate accounts with test balance for educational simulation.
2. Real-Time Telemetry & Metric Visualizers
Telemetry tools connect to a node’s internal diagnostic endpoints (such as Prometheus or Grafana metrics) to monitor system health:
- Peer Topology Graphs: Visualizing inbound and outbound P2P gossip connections, peer latency, and geographic node distribution.
- Mempool Depth Monitors: Watching transactions enter the queue, get filtered, and package into candidate blocks.
- CPU & Disk I/O Gauges: Measuring the computational overhead of state verification during high transaction volume.
3. Command-Line Interface (CLI) Diagnostic Utilities
The command line remains the most direct tool for inspecting blockchain protocol state:
# Example educational CLI commands for inspecting node state
dime-cli status --url http://127.0.0.1:8899
dime-cli cluster-nodes --output json
dime-cli block latest --verbose
dime-cli account-info <PUBLIC_ADDRESS>
These tools allow developers to:
- Inspect raw transaction byte buffers before and after signature serialization.
- Verify cryptographic proof trees against local root hashes.
- Query validator voting history and epoch transition milestones.
4. Network Packet & RPC Traffic Analyzers
Tools such as Wireshark or dedicated HTTP/WebSocket debuggers (e.g., Postman, Insomnia) allow students to inspect the exact JSON-RPC payloads sent between user applications and nodes:
- Observing subscription event streams (
logsSubscribe,blockSubscribe). - Benchmarking RPC server response latencies under concurrent queries.
- Debugging serialization errors in custom client implementations.
Conclusion & Educational Advice
When studying decentralized architecture, combining theoretical documentation with hands-on inspection through local desktop utilities is the fastest path to mastering system internals.
Explore Related Educational Resources
Continue your journey through our structured glossary or join a live cohort session for hands-on architectural discussion.